Comparing 16S databases
Requirements
NOTE: This analysis requires at least 10Gb of RAM to run. It uses large files not included in the repository and many steps can take a few minutes to run.
Analysis input/output
input_folder <- "raw_input" # Where all the large input files are. Ignored by git.
output_folder <- "results" # Where plots will be saved
output_format <- "pdf" # The file format of saved plots
pub_fig_folder <- "publication"
revision_n <- 1
result_path <- function(name) {
  file.path(output_folder, paste0(name, ".", output_format))
}
save_publication_fig <- function(name, figure_number) {
  file.path(result_path(name), paste0("revision_", revision_n), paste0("figure_", figure_number, "--", name, ".", output_format))
}
Run individual analyses
This analysis just compiles the results from the three seperate analyses corresponding to the three reference databases being compared: RDP (Maidak et al. 2001), SILVA (Quast et al. 2012), and Greengenes (DeSantis et al. 2006). The code below will run those three analyses, but it is not needed if they have been already run independently and it is not run during the rendering of this page.
Load plots
After the three analyses have been completed, I loaded their results.
Combine plots
I then combine plots from the three analyses into a single graph and save the result.
library(gridExtra)
library(grid)
library(metacoder)
combo_plot <- grid.arrange(ncol = 2, nrow = 3,
                           top = "Whole database                                                           Not amplified        ",
                           left = "Greengenes                                                      RDP                                                              SILVA",
                           silva_plot_all, silva_plot_pcr_fail,
                           rdp_plot_all, rdp_plot_pcr_fail,
                           greengenes_plot_all, greengenes_plot_pcr_fail)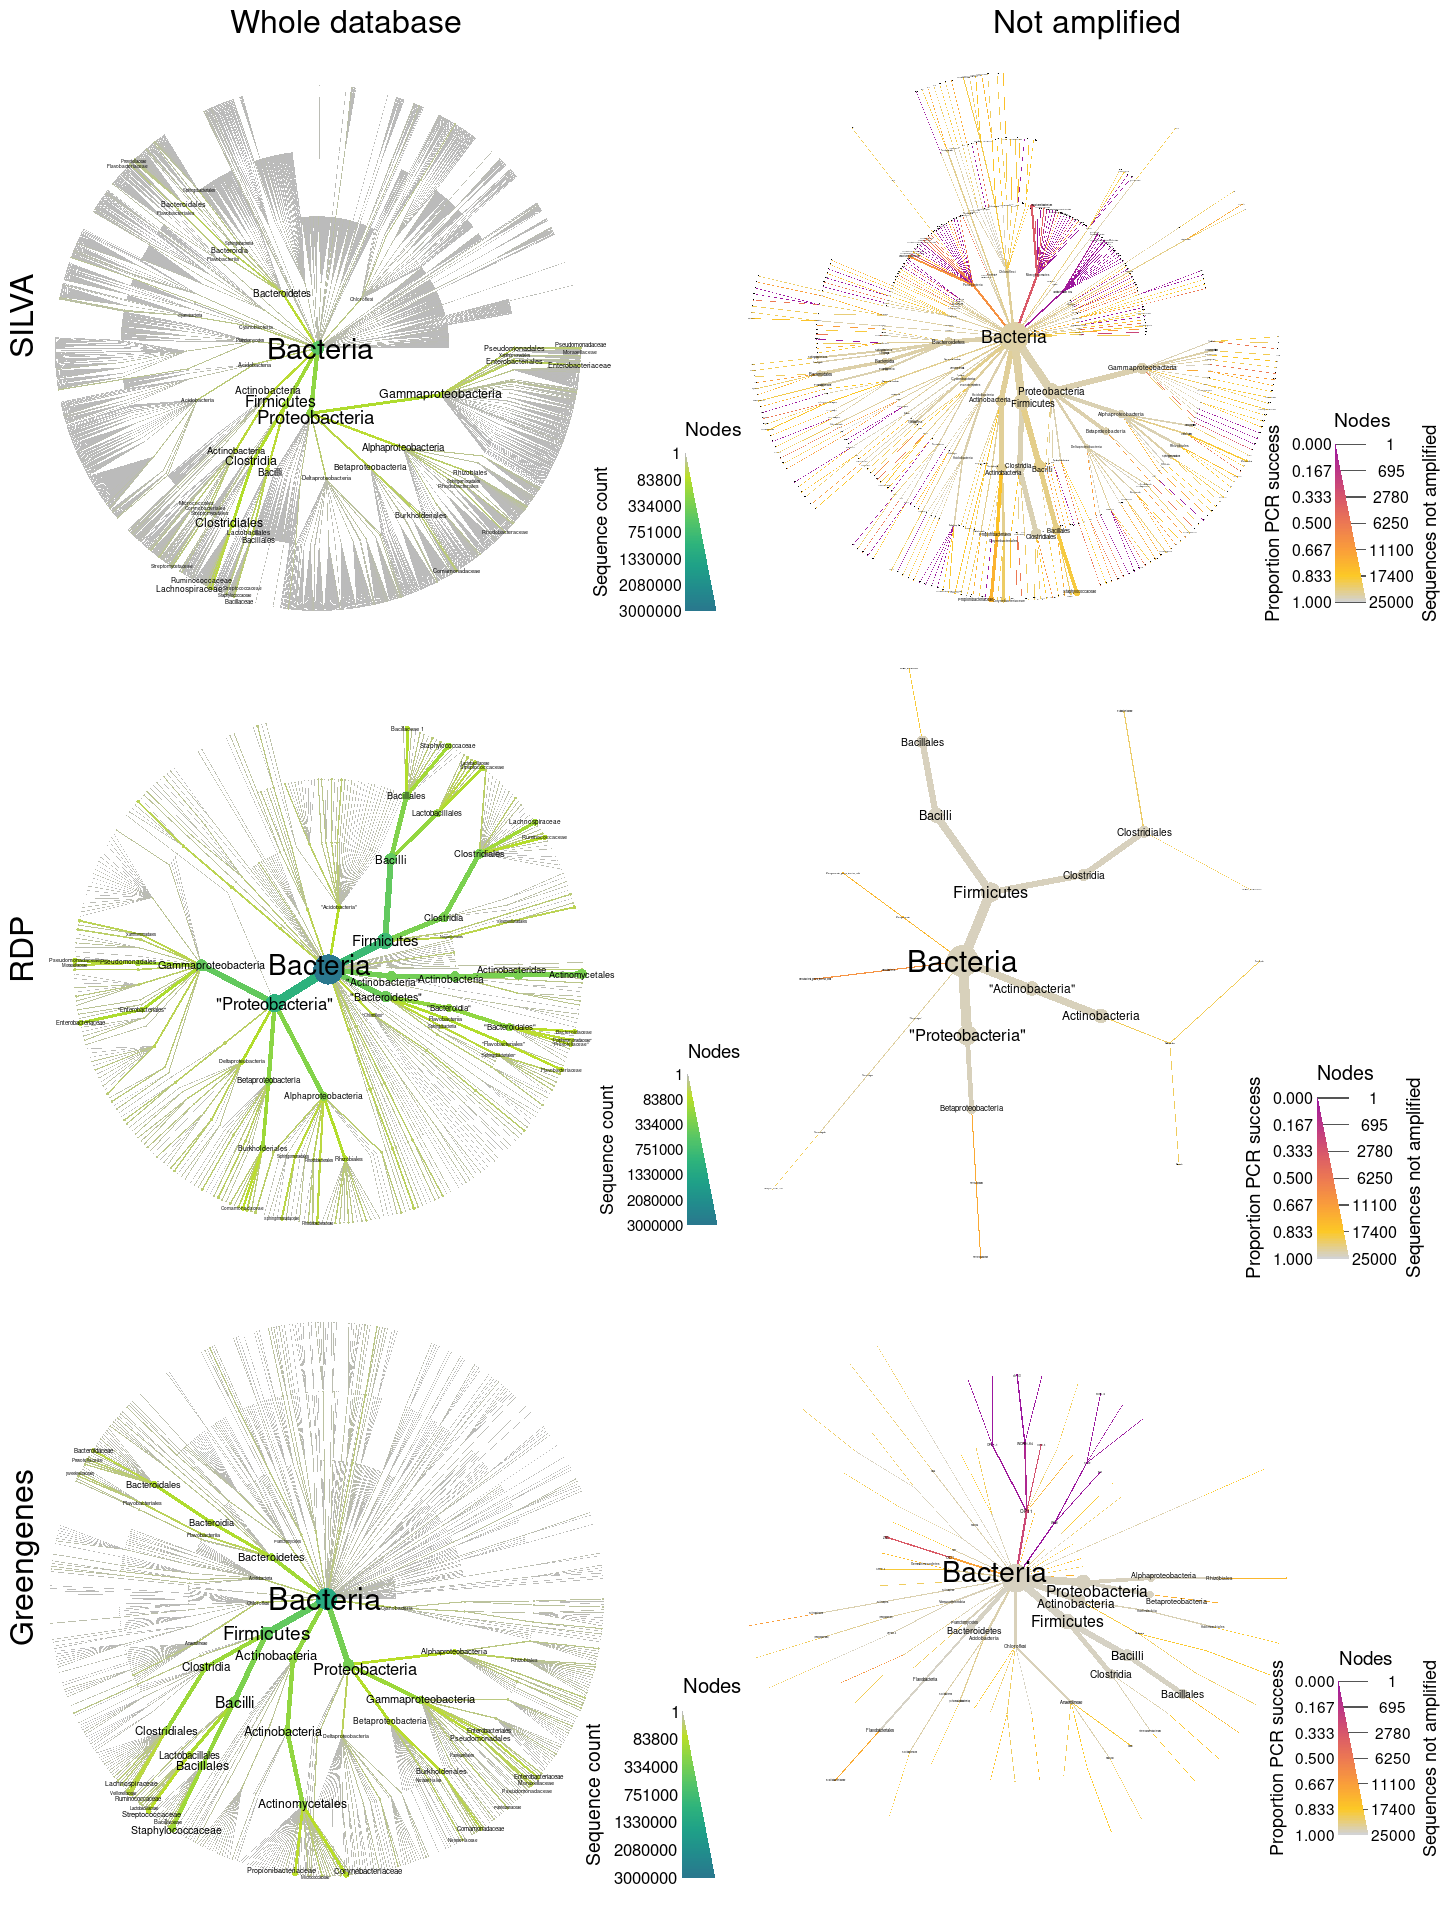
output_path <- file.path(output_folder, "figure_2--16s_database_comparison.pdf")
ggplot2::ggsave(output_path, combo_plot, width = 7.5, height = 10)
file.copy(output_path, "publication/revision_1/figure_4.pdf")
## [1] FALSE
Software and packages used
## R version 4.0.3 (2020-10-10)
## Platform: x86_64-pc-linux-gnu (64-bit)
## Running under: Pop!_OS 20.04 LTS
##
## Matrix products: default
## BLAS:   /usr/lib/x86_64-linux-gnu/blas/libblas.so.3.9.0
## LAPACK: /usr/lib/x86_64-linux-gnu/lapack/liblapack.so.3.9.0
##
## locale:
##  [1] LC_CTYPE=en_US.UTF-8       LC_NUMERIC=C               LC_TIME=en_US.UTF-8
##  [4] LC_COLLATE=en_US.UTF-8     LC_MONETARY=en_US.UTF-8    LC_MESSAGES=en_US.UTF-8
##  [7] LC_PAPER=en_US.UTF-8       LC_NAME=C                  LC_ADDRESS=C
## [10] LC_TELEPHONE=C             LC_MEASUREMENT=en_US.UTF-8 LC_IDENTIFICATION=C
##
## attached base packages:
## [1] grid      stats     graphics  grDevices utils     datasets  methods   base
##
## other attached packages:
## [1] gridExtra_2.3        metacoder_0.3.5      stringr_1.4.0        glossary_0.1.0
## [5] knitcitations_1.0.12 knitr_1.33
##
## loaded via a namespace (and not attached):
##  [1] tidyselect_1.1.1  xfun_0.24         bslib_0.2.5.1     purrr_0.3.4       colorspace_2.0-2
##  [6] vctrs_0.3.8       generics_0.1.0    htmltools_0.5.1.1 yaml_2.2.1        utf8_1.2.1
## [11] rlang_0.4.11      jquerylib_0.1.4   pillar_1.6.1      glue_1.4.2        DBI_1.1.1
## [16] lifecycle_1.0.0   plyr_1.8.6        ggfittext_0.9.1   munsell_0.5.0     gtable_0.3.0
## [21] codetools_0.2-16  evaluate_0.14     labeling_0.4.2    tzdb_0.1.2        fansi_0.5.0
## [26] highr_0.9         Rcpp_1.0.7        readr_2.0.0       scales_1.1.1      jsonlite_1.7.2
## [31] farver_2.1.0      ggplot2_3.3.5     hms_1.1.0         digest_0.6.27     stringi_1.7.3
## [36] dplyr_1.0.7       bibtex_0.4.2.3    cli_3.0.1         tools_4.0.3       magrittr_2.0.1
## [41] sass_0.4.0        tibble_3.1.3      RefManageR_1.3.0  crayon_1.4.1      pkgconfig_2.0.3
## [46] ellipsis_0.3.2    xml2_1.3.2        lubridate_1.7.10  assertthat_0.2.1  rmarkdown_2.9
## [51] httr_1.4.2        rstudioapi_0.13   R6_2.5.0          compiler_4.0.3
References
DeSantis, Todd Z, Philip Hugenholtz, Neils Larsen, Mark Rojas, Eoin L Brodie, Keith Keller, Thomas Huber, Daniel Dalevi, Ping Hu, and Gary L Andersen. 2006. “Greengenes, a Chimera-Checked 16S rRNA Gene Database and Workbench Compatible with Arb.” Applied and Environmental Microbiology 72 (7): 5069–72.
Maidak, Bonnie L, James R Cole, Timothy G Lilburn, Charles T Parker Jr, Paul R Saxman, Ryan J Farris, George M Garrity, Gary J Olsen, Thomas M Schmidt, and James M Tiedje. 2001. “The Rdp-Ii (Ribosomal Database Project).” Nucleic Acids Research 29 (1): 173–74.
Quast, Christian, Elmar Pruesse, Pelin Yilmaz, Jan Gerken, Timmy Schweer, Pablo Yarza, Jörg Peplies, and Frank Oliver Glöckner. 2012. “The Silva Ribosomal Rna Gene Database Project: Improved Data Processing and Web-Based Tools.” Nucleic Acids Research, gks1219.