Data Preparation
ZN Kamvar, SE Everhart and NJ Grünwald
This section will briefly go over the basics of data import into poppr. For this section, we will focus on the GenAlEx format. Other formats are supported and details are given in the R help page for the adegenet function import2genind. We will show examples of haploid, diploid, and polyploid data sets and show you how you can format your data if it’s grouped into multiple stratifications.
Appendix 1 provides an overview and description of the data sets used in this primer.
Importing data
GenAlEx formatted data
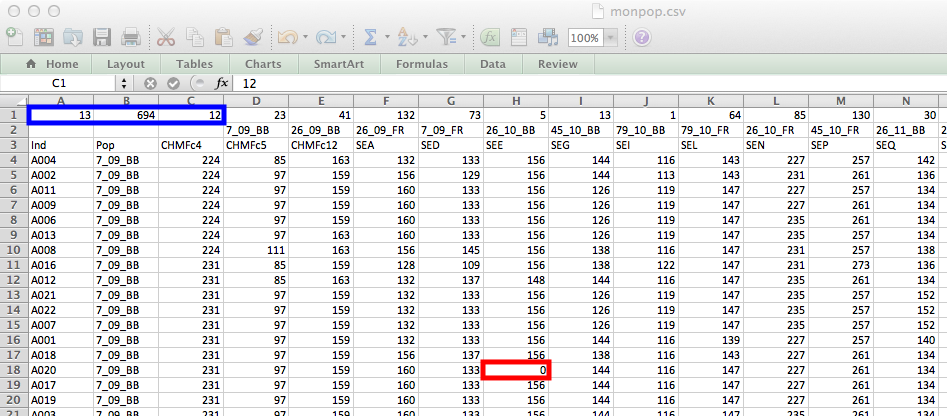
To start simple, let’s examine the input file for the monpop data set containing 694 isolates of the plant pathogen Monilinia fructicola genotyped over 13 haploid microsatellite loci (Everhart & Scherm, 2015). The data set is called monpop.csv.
Note that
*.csvstands for comma-separated-value. This can be opened in a text editor or excel.*.csvis a good format for portability into R.
To import GenAlEx formatted data into poppr, you should use the function read.genalex. Below is an example using monpop.csv.
##
## This is a genclone object
## -------------------------
## Genotype information:
##
##    264 multilocus genotypes
##    694 haploid individuals
##     13 codominant loci
##
## Population information:
##
##      1 stratum - Pop
##     12 populations defined -
## 7_09_BB, 26_09_BB, 26_09_FR, ..., 45_10_FR, 26_11_BB, 26_11_FR
There are other options for genalex formatted data, such as xy coordinates. We won’t cover the other options, but type
help("read.genalex")in your R console for details.
Other data formats
Given dependence of poppr on adegenet, users can import data from the following formats
- FSTAT (file.dat)
- GENETIX (file.gtx)
- GENEPOP (file.gen)
- STRUCTURE (file.str)
The adegenet function import2genind will import all of these formats. If you have sequence data, you can use the read.FASTA function from the ape package. If your data is in any other format, type help("df2genind") for guidance.
GenAlEx data format
GenAlEx is a very popular add-on for Microsoft Excel. It is relatively easy to use because of its familiar, menu-driven interface. It also gives the user the option to include information on population groupings, regional groupings, and xy coordinates. The flexibility of this format made it a clear choice for import into poppr.
The data format is standard in that individuals are defined in the rows and loci are defined in the columns. The first two rows are reserved for metadata and the first two columns are reserved for the individual names and population names, respectively. The examples we will be using include haploid, diploid and polyploid data.
Basic Format
Below is what the monpop (haploid) data looks like. Highlighted in red is how missing data should be coded for SSR markers. Highlighted in blue are the parts of the metadata rows used by poppr. These three numbers represent:
| A | B | C |
|---|---|---|
| loci | samples | populations |
monpop
The columns of the metadata beyond those three rows define the number of individuals contained within each population. Since this data is redundant with the second column, it is not necessary. Notice, also, that the second column, reserved for the population assignments, has a pattern of underscores in the populations. This will be important at the end of this section. Below is a modified version of the input format that should make it easier to format.

monpop_ideal
Highlighted in blue is the cell that defines the number of columns highlighted in red. If we set this number to 1, then we do not have to enter in any information in those columns. Try it for yourself.
Diploids
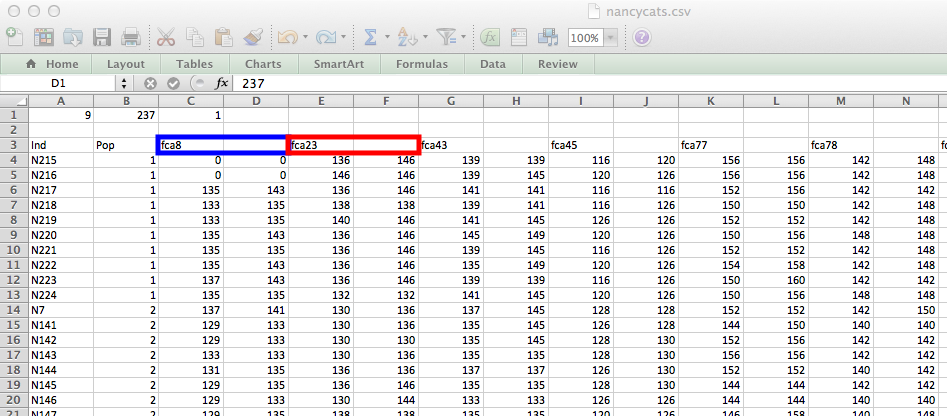
Diploid data is only different in the fact that you will have two alleles per locus. This is coded such that each allele is in a separate column. Below is an example of the nancycats data set (from the adegenet package), exported like above. Highlighted in blue and red are the first and second loci, respectively.
diploid
Polyploids
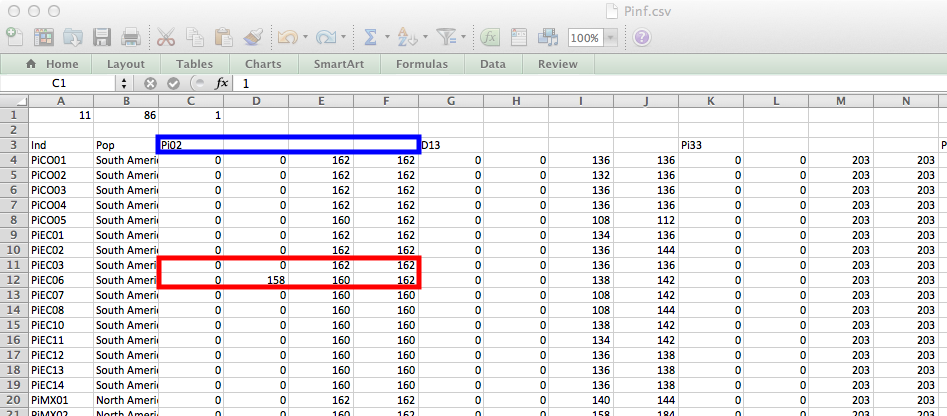
GenAlEx does not handle polyploids, but since poppr can do it, we have set up a scheme to allow import of polyploids via this format. The limitation is that all of your loci have to have the same observed ploidy. Below is the example of Phytophthora infestans in the data set Pinf where some genotypes had observed tetraploid loci (Goss et al., 2014).
tetraploid
Highlighted in blue is the first locus and highlighted in red are two samples at that locus, an observed diploid and observed triploid. Note the extra zeroes needed to make the genotype tetraploid.
Population strata
A hierarchical sampling approach is necessary to infer structure of populations in space or time. Poppr facilitates definition of stratified data by concatenating the different stratifications into a single column by a common separator (“_” by default). Here’s an example of the three stratifications of the monpop data set introduced above:
| Tree | Year | Symptom |
|---|---|---|
| 7 | 9 | BB |
| 7 | 9 | BB |
| 7 | 9 | BB |
| 7 | 9 | BB |
| 7 | 9 | BB |
| 7 | 9 | BB |
resulting in definition for use in poppr as:
| Tree_Year_Symptom |
|---|
| 7_9_BB |
| 7_9_BB |
| 7_9_BB |
| 7_9_BB |
| 7_9_BB |
| 7_9_BB |
If you do not want to concatenate your population factors into one row, save them as a separate csv file and use the functions
read.tableandstrataafter you’ve imported your genetic data to achieve the same result.
The data imported this way can be accessed with the function splitStrata:
##
## This is a genclone object
## -------------------------
## Genotype information:
##
##    264 multilocus genotypes
##    694 haploid individuals
##     13 codominant loci
##
## Population information:
##
##      1 stratum - Pop
##     12 populations defined -
## 7_09_BB, 26_09_BB, 26_09_FR, ..., 45_10_FR, 26_11_BB, 26_11_FR##
## This is a genclone object
## -------------------------
## Genotype information:
##
## 264 multilocus genotypes
## 694 haploid individuals
## 13 codominant loci
##
## Population information:
##
## 3 strata - Tree, Year, Symptom
## 12 populations defined -
## 7_09_BB, 26_09_BB, 26_09_FR, ..., 45_10_FR, 26_11_BB, 26_11_FRThis is detailed in our chapter on population strata.
References
Everhart S., Scherm H. 2015. Fine-scale genetic structure of Monilinia fructicola during brown rot epidemics within individual peach tree canopies. Phytopathology 105:542–549. Available at: https://doi.org/10.1094/PHYTO-03-14-0088-R
Goss EM., Tabima JF., Cooke DEL., Restrepo S., Fry WE., Forbes GA., Fieland VJ., Cardenas M., Grünwald NJ. 2014. The Irish potato famine pathogen phytophthora infestans originated in central mexico rather than the andes. Proceedings of the National Academy of Sciences 111:8791–8796. Available at: http://www.pnas.org/content/early/2014/05/29/1401884111.abstract